Corporate Environmental Action Tracker Methodology
Overview
The Corporate Environmental Action Tracker (CEAT) shows, at an aggregated level, the status of action on climate by companies disclosing through CDP. The tracker gives companies, capital markets, policymakers and civil society access to insights from the world’s largest environmental data set to help inform decisions and understand corporate progress towards and potential impact of current commitments disclosed through CDP.
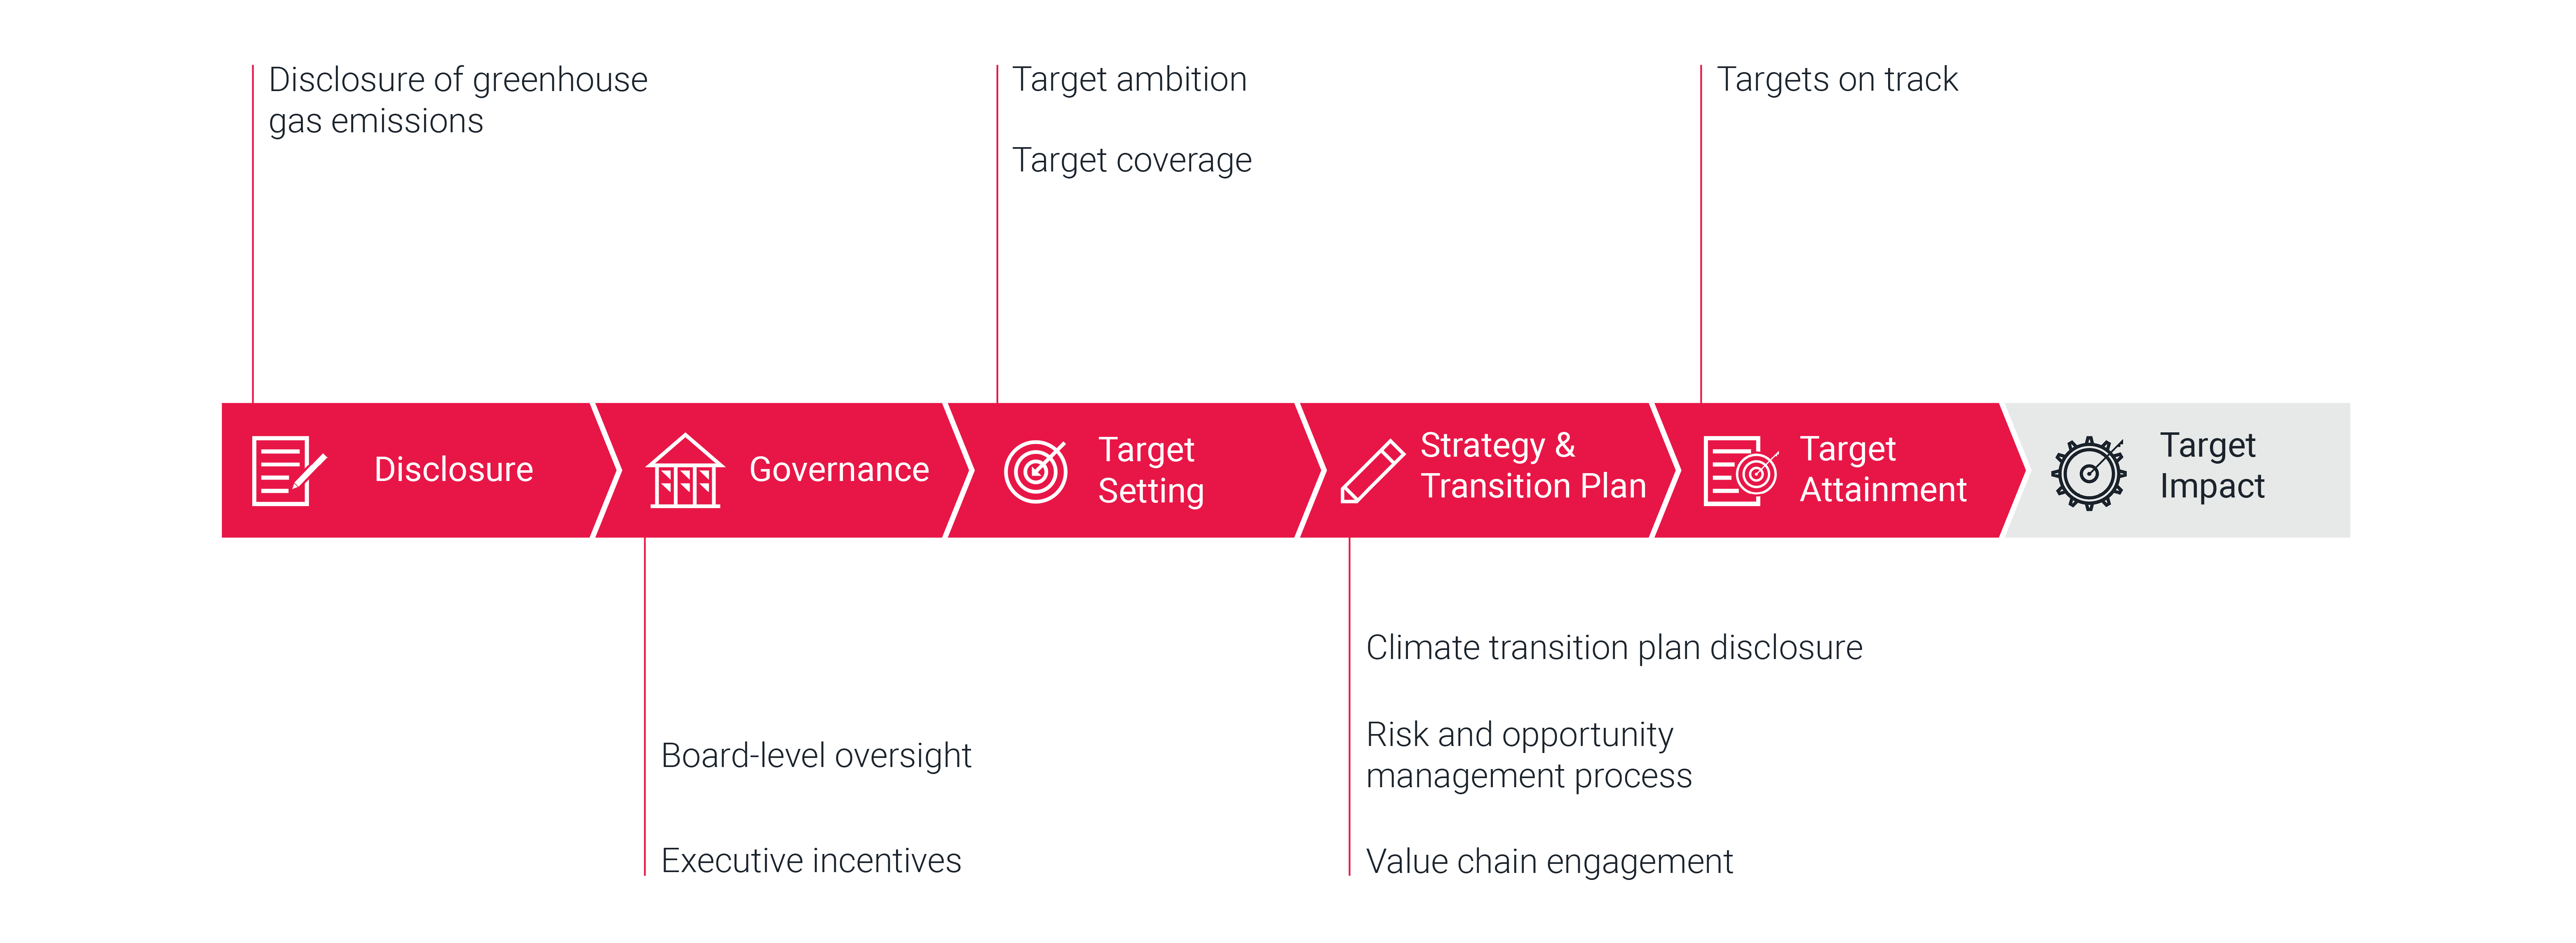
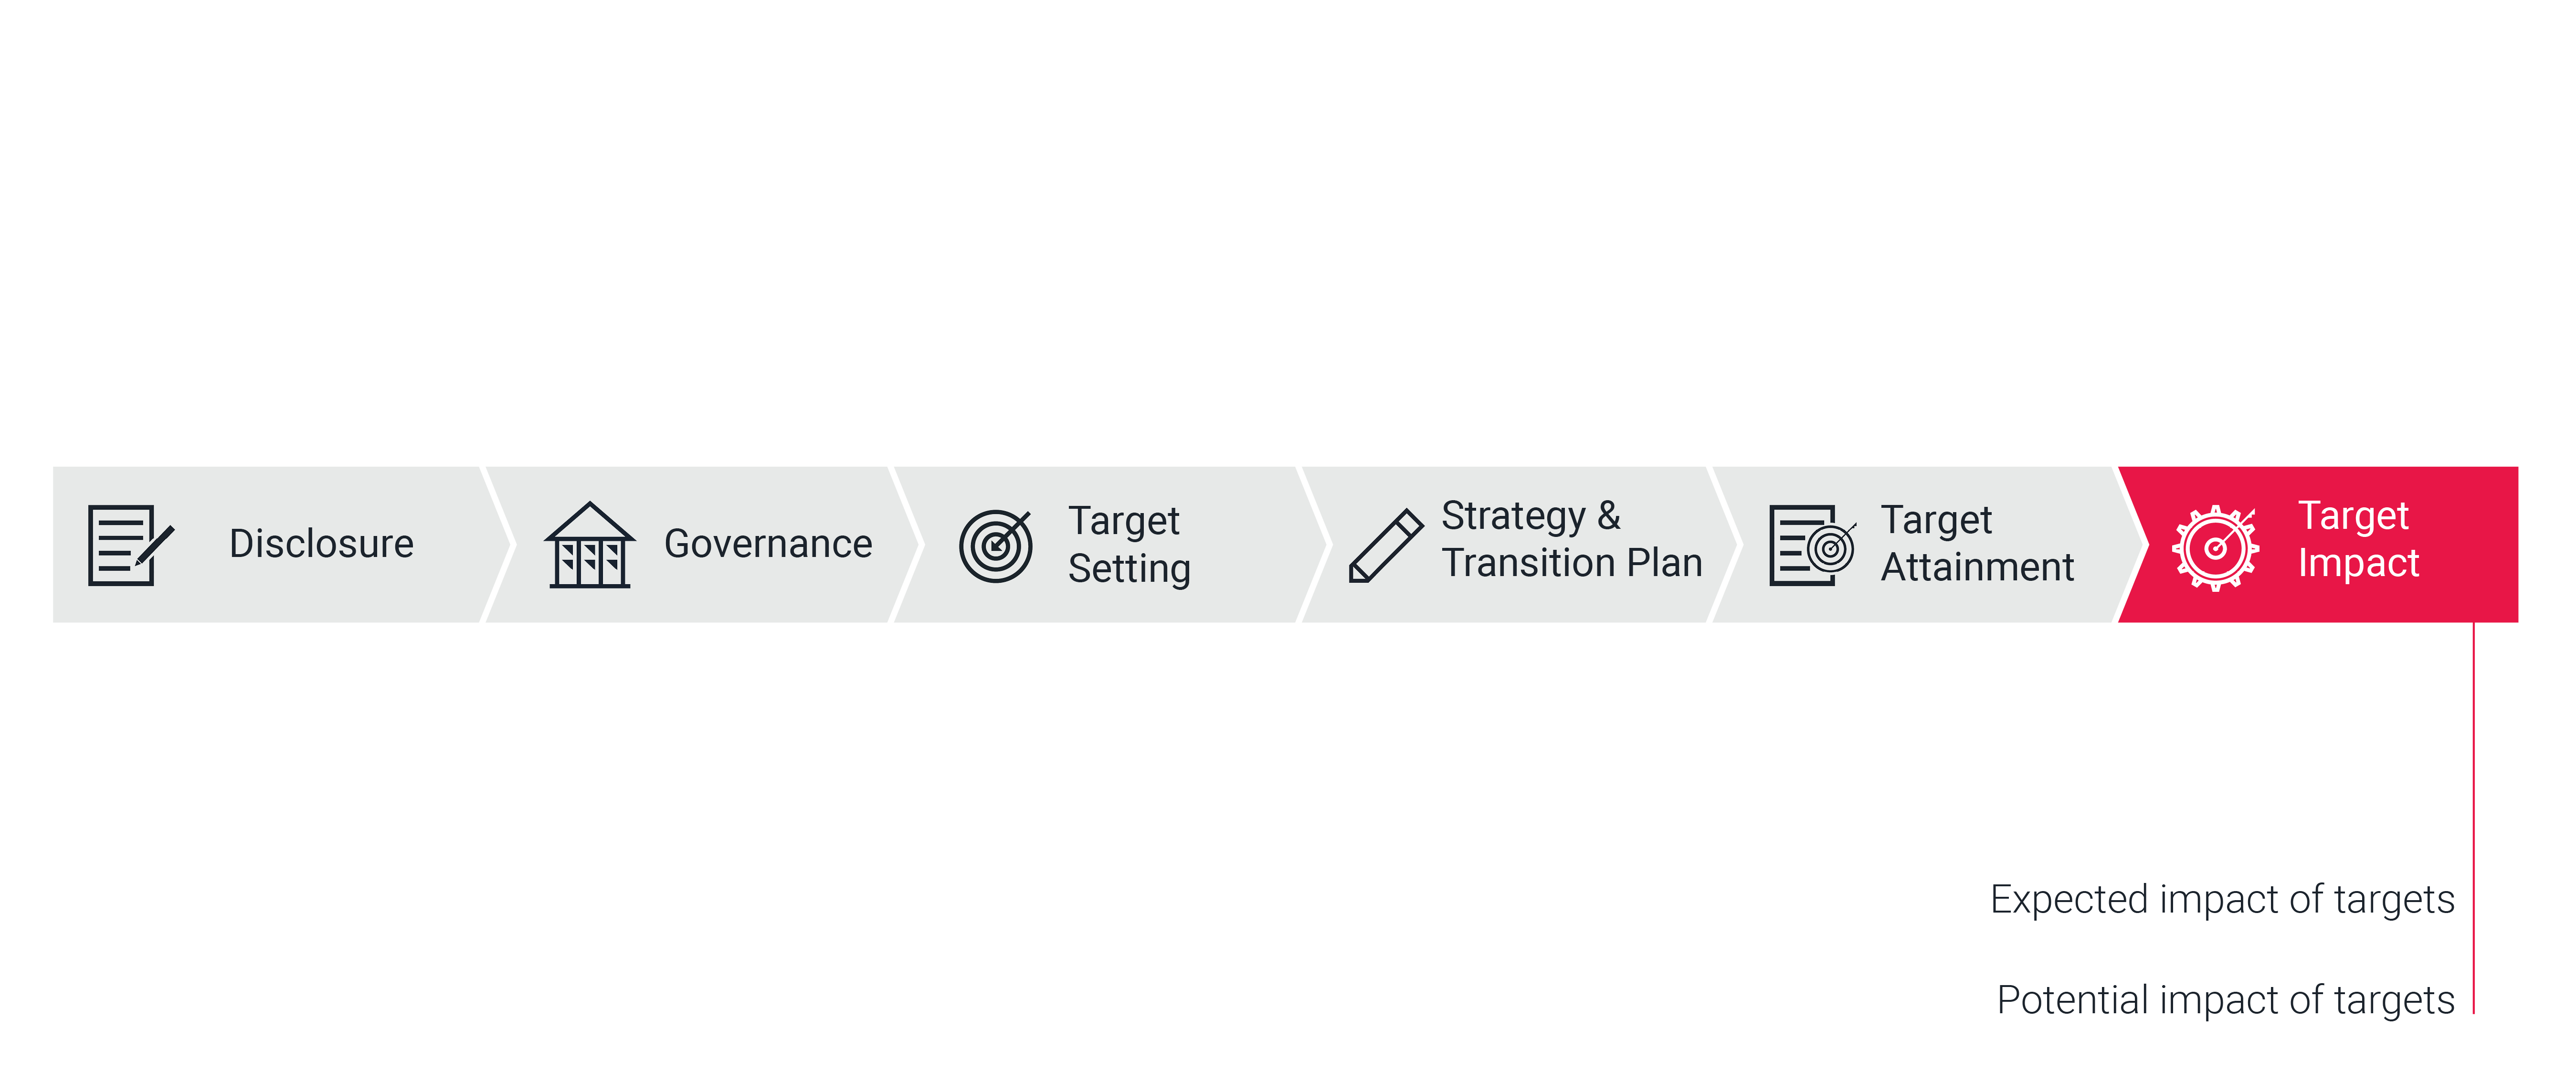
The tracker is organized in six steps, which represent a company’s transition journey: Disclosure, Governance, Target Setting, Transition Plan & Strategy, Target Attainment and Target Impact.
Each step contains indicators used to measure progress.
Results are shown per reporting year and are based on all responses from one disclosure cycle [1].
For each indicator, the current status of action can be viewed at different aggregation levels:
Global: Shows results aggregated across all companies.
Country/area: Shows results aggregated across countries and areas, from companies’ country-level disclosures (Disclosure step only).
Sector: Shows results aggregated across companies by given sectors.
Index: Shows results aggregated across the companies that were part of the FTSE 100 and S&P 500 indices in the reporting year.
Level | Step | Disclosure | Governance | Target Setting | Strategy & Transition Plan | Target Attainment | Target Impact |
|---|---|---|---|---|---|---|
Global | Yes | Yes | Yes | Yes | Yes | Yes |
Country or area | Yes | |||||
Sector | Yes | Yes | Yes | Yes | Yes | Yes |
Index | Yes | Yes | Yes | Yes | Yes |
The results in the Tracker are based on the responses from companies to CDP’s climate change questionnaire [4]. Where we express the results as a percentage (eg proportion of global emissions) we use a value for total emissions derived from a combination of various external data sources. These total values serve as reference for the percentage metrics and are derived as follows:
Global
For the global level, we use total global emissions in the reporting year, based on an aggregation of countries’ emissions inventories, taken from PRIMAP, and including an estimate of bunker emissions from Climate Watch.
Sector
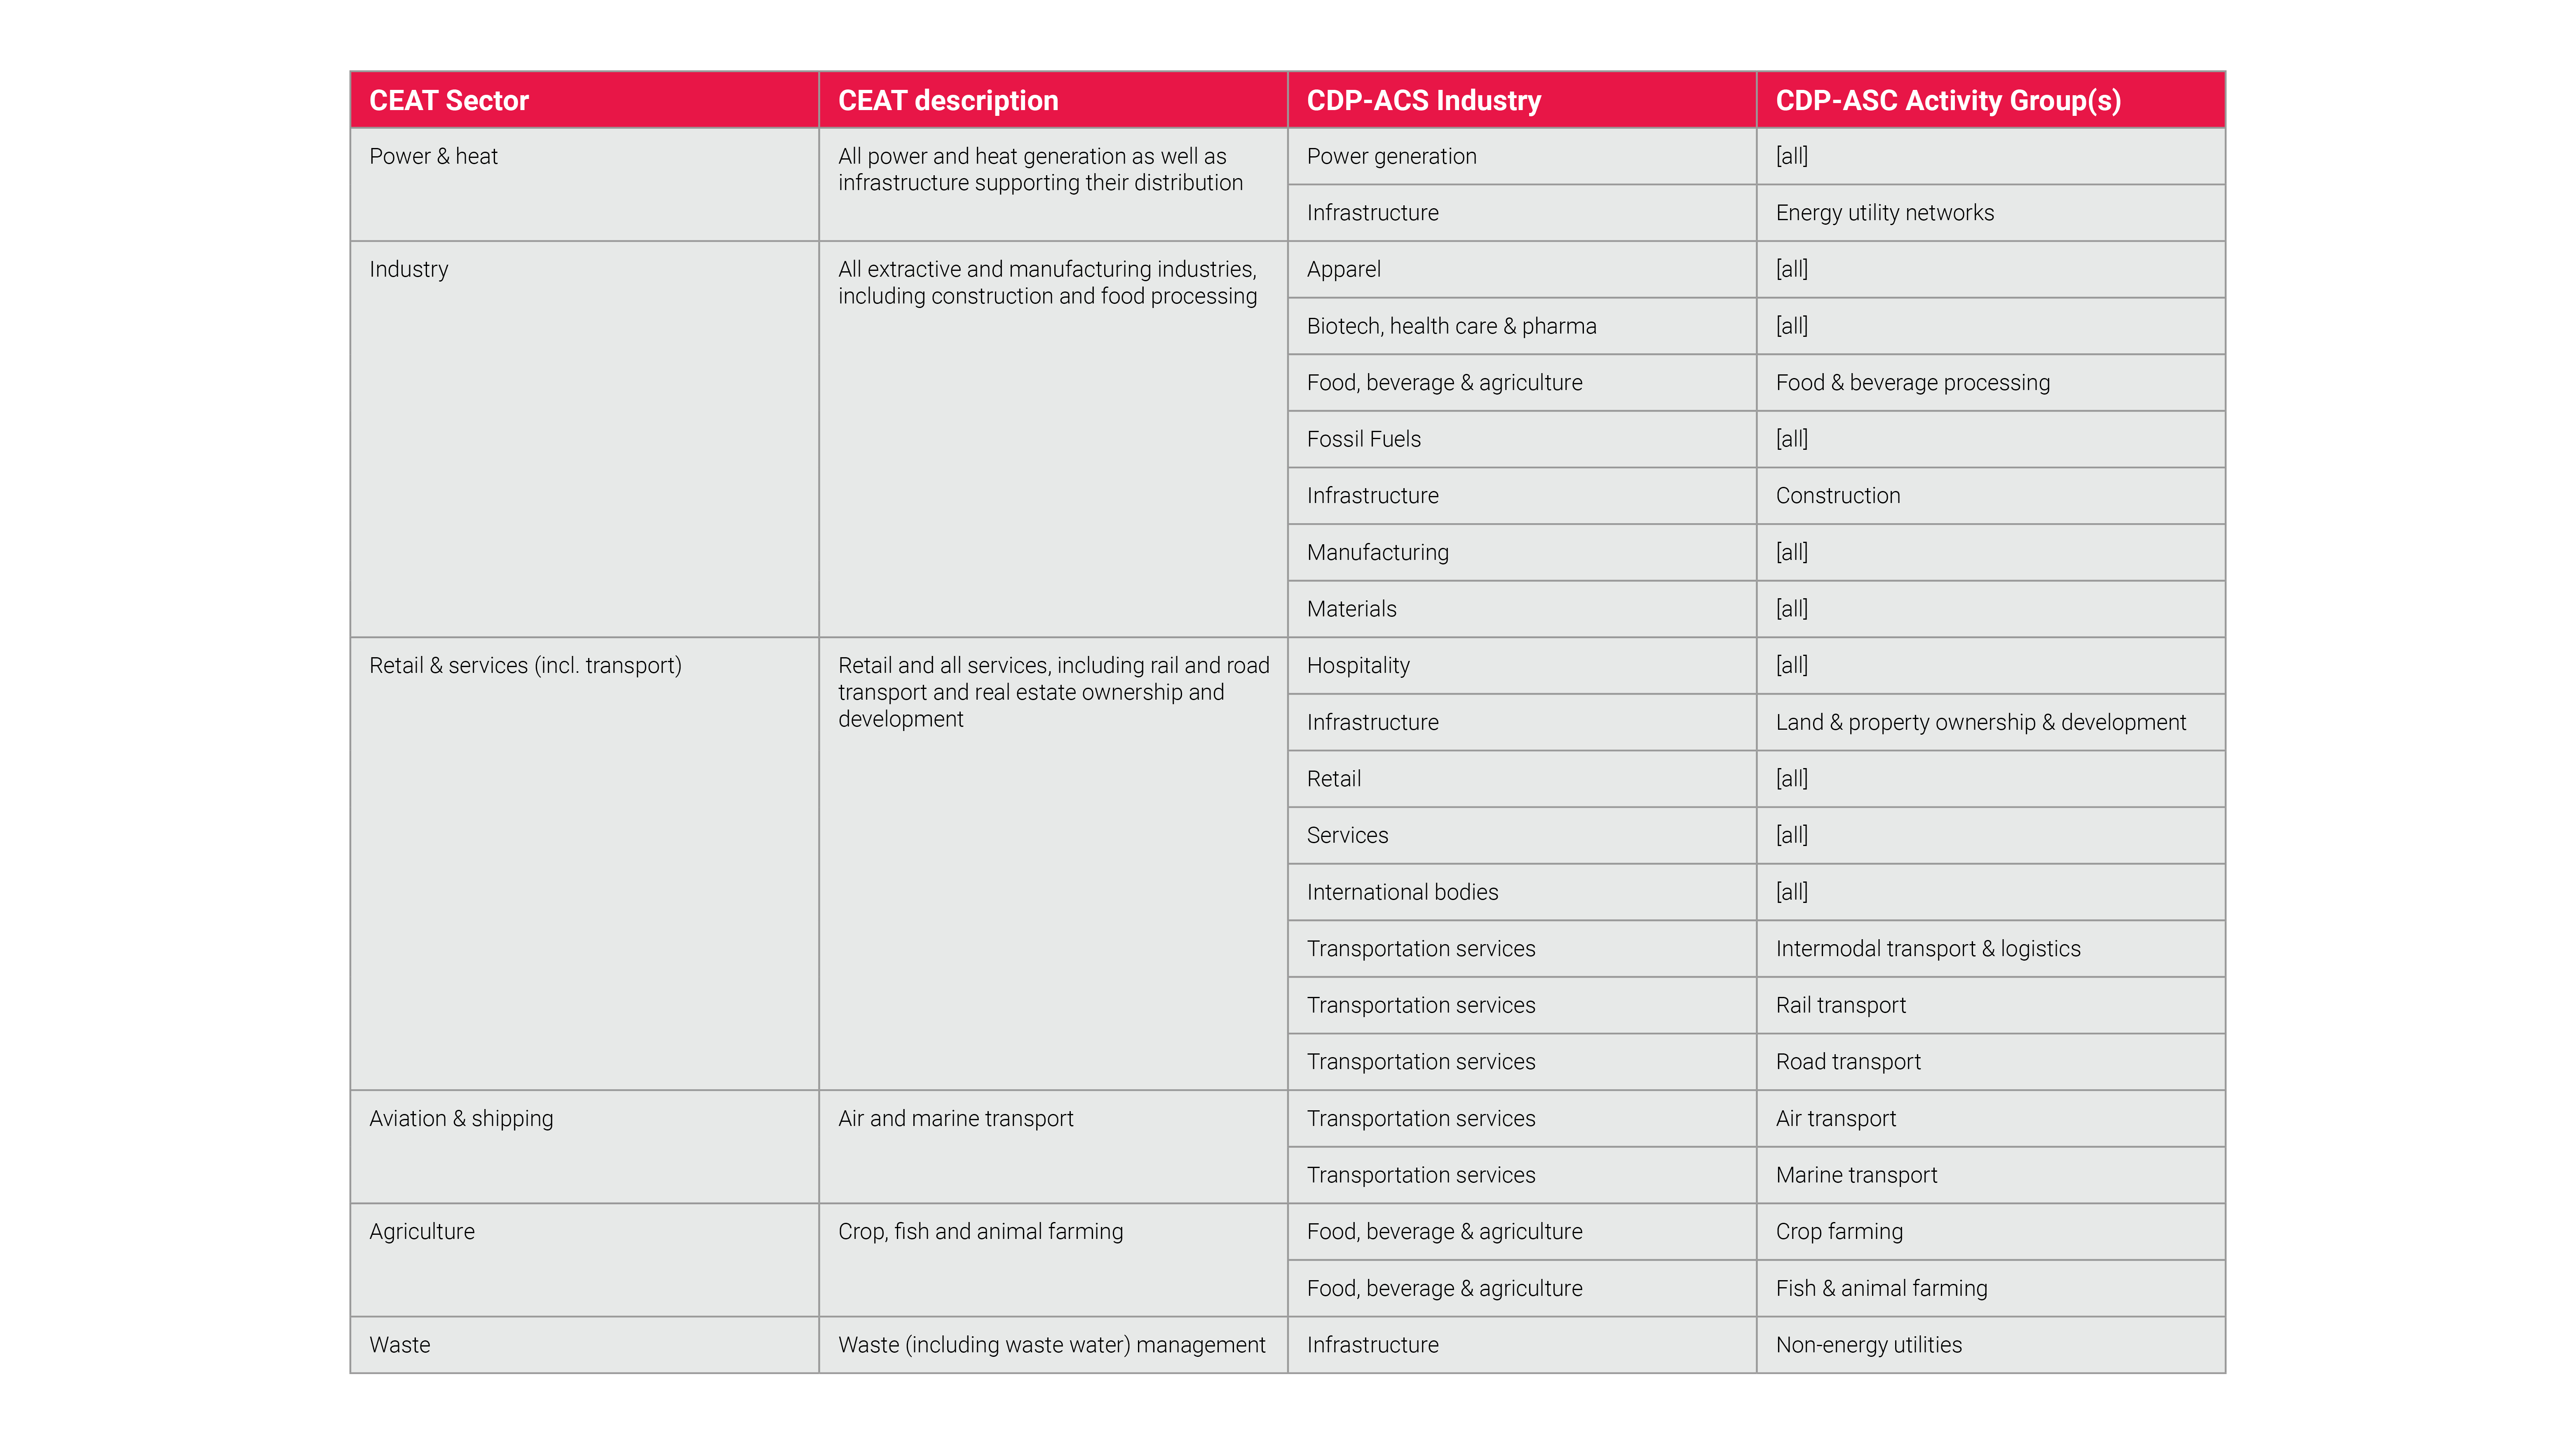
The emissions from national inventories, summed to the global level, are combined with estimates from Climate Watch to yield a total of six sectors, which are then used as the basis for the percentage metrics at sector level.
The national inventory emissions are taken from PRIMAP at the following aggregation level: Energy, Industrial Process emissions, Agriculture, Waste.
The Energy values are further subdivided using Climate Watch estimates to yield global total emissions for Power/Heat, Buildings & Transport and Industry.
The resulting inventory sectors are mapped to CDP’s Activity Classification System (CDP-ACS) to enable a mapping of each company to a single sector on the tracker.
While we are aware of uncertainties introduced by mapping all of the emissions of a company to one inventory sector, we believe these uncertainties to be relatively small. In future, we hope to be able to more accurately differentiate emissions from companies operating in multiple sectors.

View larger version of graphic
Index
For the index level, we use the total number of companies and their total combined revenue in USD to derive the percentage metrics.
Indicators
Each indicator is designed to assess climate action, based on corporate disclosure. In the tracker we differentiate between category-based indicators in Steps 1 to 5 and the impact indicators of Step 6.
Steps 1 to 5: Category indicators

View larger version of graphic
For each indicator, each company is assigned a single category, based on their responses to certain questions, or combinations of questions, in the questionnaire.
The companies are then aggregated in their categories.
Example:
For the indicator Value chain engagement in Step 4: Strategy and Transition Plan, we have defined five possible categories:
Engaging with suppliers and customers
Engaging with suppliers only
Engaging with customer only
No engagement
Limited data
These five categories are mapped to the answers to question C12.1 of the CDP climate change questionnaire [4] “Do you engage with your value chain on climate-related issues?” (see the detailed section on the Value chain indicator for details on this mapping). Every company is assigned to one of the five categories above.
In the 2023 disclosure cycle, shown as reporting year 2022 on the tracker, the following numbers of companies were assigned to each bucket. As the indicator is mainly shown in terms of the emissions of the companies contained in these buckets (rather than the number of companies), only companies that passed the emissions filtering step are included.
Category | Mt CO2e | # companies |
|---|---|---|
Suppliers and customers | ~5,700 | ~4,800 |
Suppliers only | ~1,400 | ~1,800 |
Customers only | ~1,300 | ~2,600 |
Not engaging | ~600 | ~2,900 |
Limited data | ~40 | ~260 |
Total | ~9,000 | ~12,300 |
The following section explains how the category values at company-level were derived for each indicator.
Disclosure of greenhouse gas emissions (Global, Sector, Index)
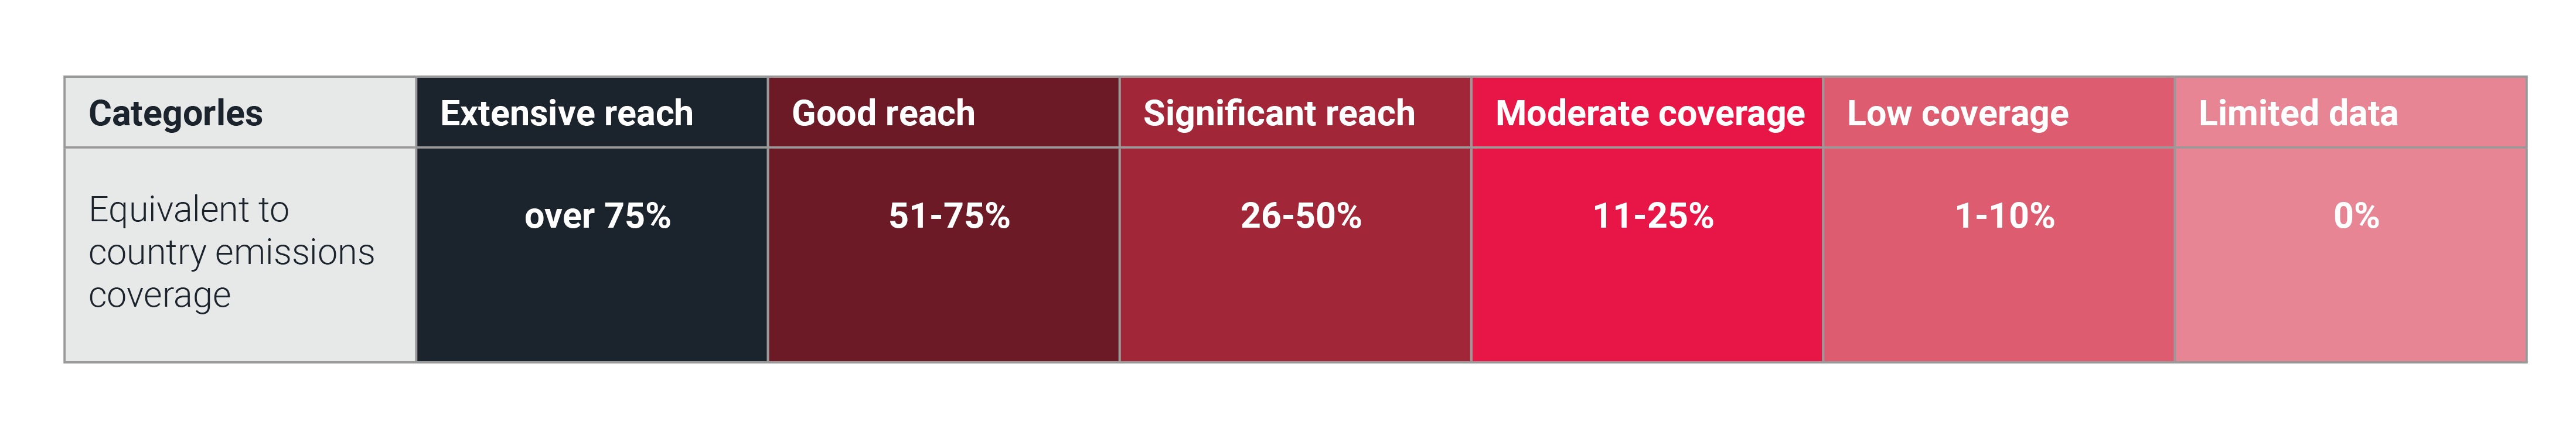
Two categories are shown for the disclosure indicator at Global, Sector and Index level.
View larger version of graphic
Any company reporting emissions through CDP is given the ‘Disclosed’ category if they passed the filtering process. This is based on the answers to these questions in the CDP climate change questionnaire [4]:
C6.1: “What were your organization’s gross global Scope 1 emissions in metric tons CO2e?”
C6.3: “What were your organization's gross global Scope 2 emissions in metric tons CO2e?”
The ‘not disclosed’ category represents our estimate of the total global/sectoral emissions that are not covered by companies currently reporting through CDP. This is the only category in the whole tracker that is based entirely on external data sources. It includes companies not (yet) disclosing through CDP, as well as non-corporate actors, such as private individuals and public institutions. The two categories ("disclosed" and "not disclosed") add up to the total global/sectoral emissions.
Disclosure of greenhouse gas emissions (Country)

View larger version of graphic
For the country-level disclosure coverage, we use the country-level emissions from those companies that provided country/area breakdown of their emissions, using responses from the following questions [4]:
C7.2: “Break down your total gross global Scope 1 emissions by country/region.”
C7.5: “Break down your total gross global Scope 2 emissions by country/region.”
We then aggregate the emissions across countries and compare with the country’s inventory emissions for the reporting year. Countries are assigned a category based on the share of their emissions that companies have reported on in their country-level reporting.
Countries need to have emissions reported from at least 20 companies to have their data displayed, otherwise they are given the ‘Limited data’ category.
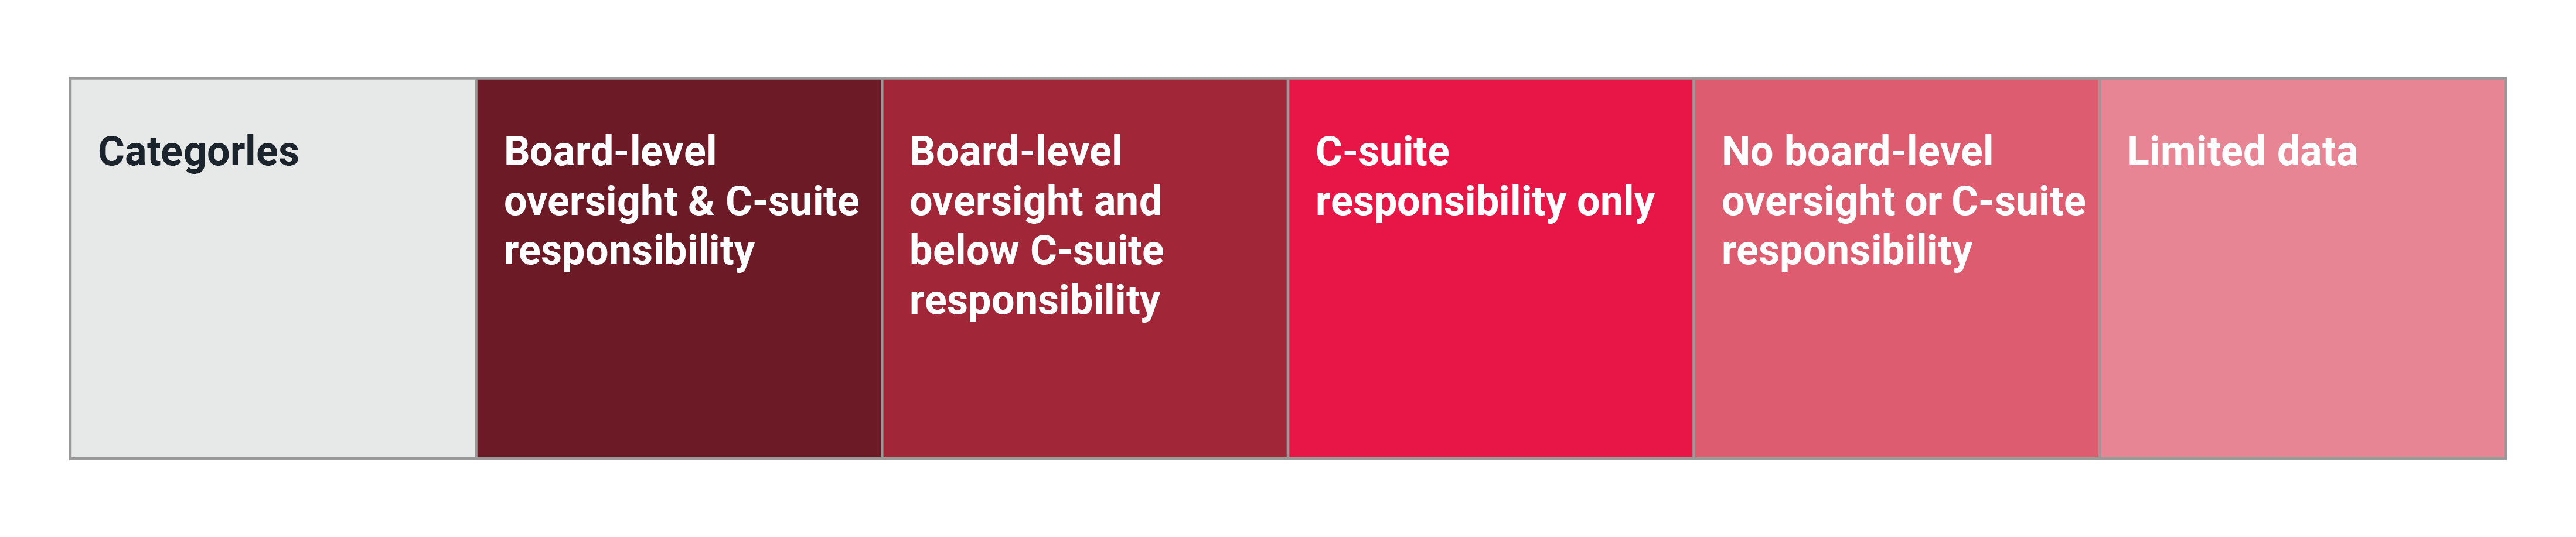
Board-level oversight
We have defined five categories for this indicator across all levels.

View larger version of graphic
The categories are based on a combination of answers to two questions in the CDP climate change questionnaire [4]:
C1.1: “Is there board-level oversight of climate-related issues within your organization?”
C1.2: “Provide the highest management-level position(s) or committee(s) with responsibility for climate-related issues.”
Executive incentives
We have defined five categories for this indicator across all levels.

View larger version of graphic
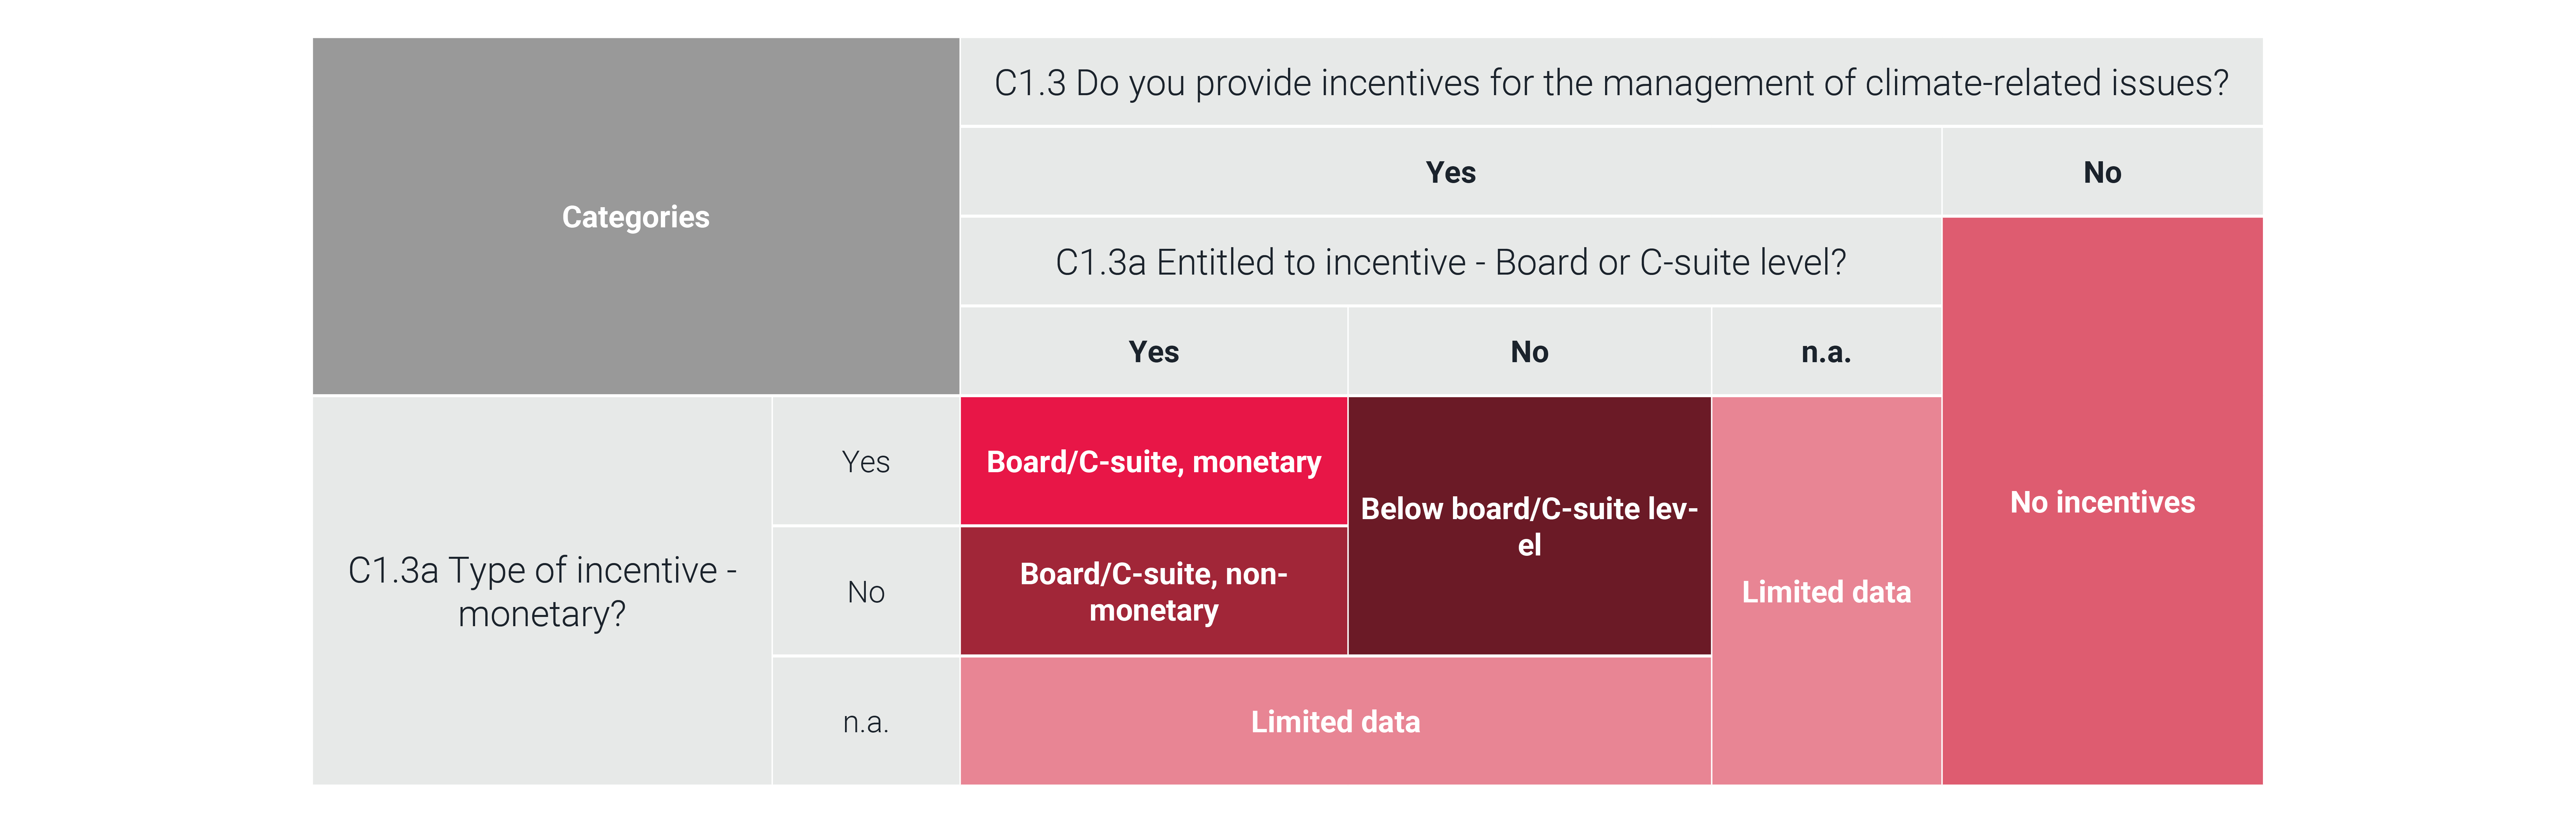
The categories are based on a combination of answers to question C1.3 and C1.3a in the CDP climate change questionnaire [4].
C1.3: “Do you provide incentives for the management of climate-related issues [..]?”
C1.3a: “Provide [..] details on the incentives provided for the management of climate-related issues [..].”
C1.3a allows multiple responses per organization, with each response representing an incentive with its properties. Respondents can specify which level in the organization is incentivized, which informs the Board/C-suite component of our category. They can also specify whether incentives are monetary in nature or not.
Target ambition
We have defined five categories for this indicator across all levels.

View larger version of graphic
For information on whether or not the organization has a target, we look at the target setting question in the questionnaire[4]:
C4.1: “Did you have an emissions target that was active in the reporting year?”
For all organizations that disclose having an active emissions target and fully provided details for their targets in C4.1a and/or C4.1b, we review the Science Based Targets initiative (SBTi) list of approved targets and corresponding approval dates. If the organization submitted at least one target in the questionnaire for that year and their SBTi approval date precedes the end of the questionnaire reporting period, we give the company a category based on the strength of their current approved SBTi target. However, if the organization answered ‘No’ to C4.1 or answered ‘Yes’ but then did not provide further details on the target in questions C4.1a or C4.1b, we consider this an incomplete response and set their category to ‘No target’. Note that for the aggregation, all Scope 1 / 2 emissions of the company are taken into account, irrespective of the emissions coverage of individual targets. The SBTi requires approved targets to cover at least 95% of combined Scope 1 and 2 company-wide emissions.
Target coverage
We have defined four categories for this indicator across all levels.

View larger version of graphic
For this indicator we look at all absolute and intensity-based emissions targets of an organization and check whether any target covers Scope 3 emissions. This results in a category at company level (across all targets).
The information is taken from the target setting questions in the questionnaire [4], namely:
C4.1a: “Provide details of your absolute emissions target(s) and progress made against those targets.”
C4.1b: “Provide details of your emissions intensity target(s) and progress made against those target(s)."
Note that for the aggregation, all Scope 1 / 2 emissions of the company are taken into account, irrespective of the emissions coverage of individual targets.
Climate transition plan disclosure
We have defined five categories for this indicator across all levels.

View larger version of graphic
This indicator displays results from CDP’s Climate Transition Plan disclosure analysis, which has been published annually since the 2021 disclosure cycle.
The indicator is a measure of the completeness of a company’s transition plan disclosure.
The categories show the proportion of key indicators of a credible climate transition plan that the company disclosed information to in that year’s disclosure. A total of 21 indicators are assessed. A score of 50% indicates that the organization submitted a response to questions covering at least 11 of the 21 key indicators. Find further information about our Climate Transition Plan analysis.
Risk and opportunity management process
We have defined five categories for this indicator across all levels.
View larger version of graphic
The categories are based on a combination of answers to these two questions in the CDP climate change questionnaire [4]:
C2.1: “Does your organization have a process for identifying, assessing, and responding to climate-related risks and opportunities?”
C2.2: “Describe your process(es) for identifying, assessing and responding to climate-related risks and opportunities.”
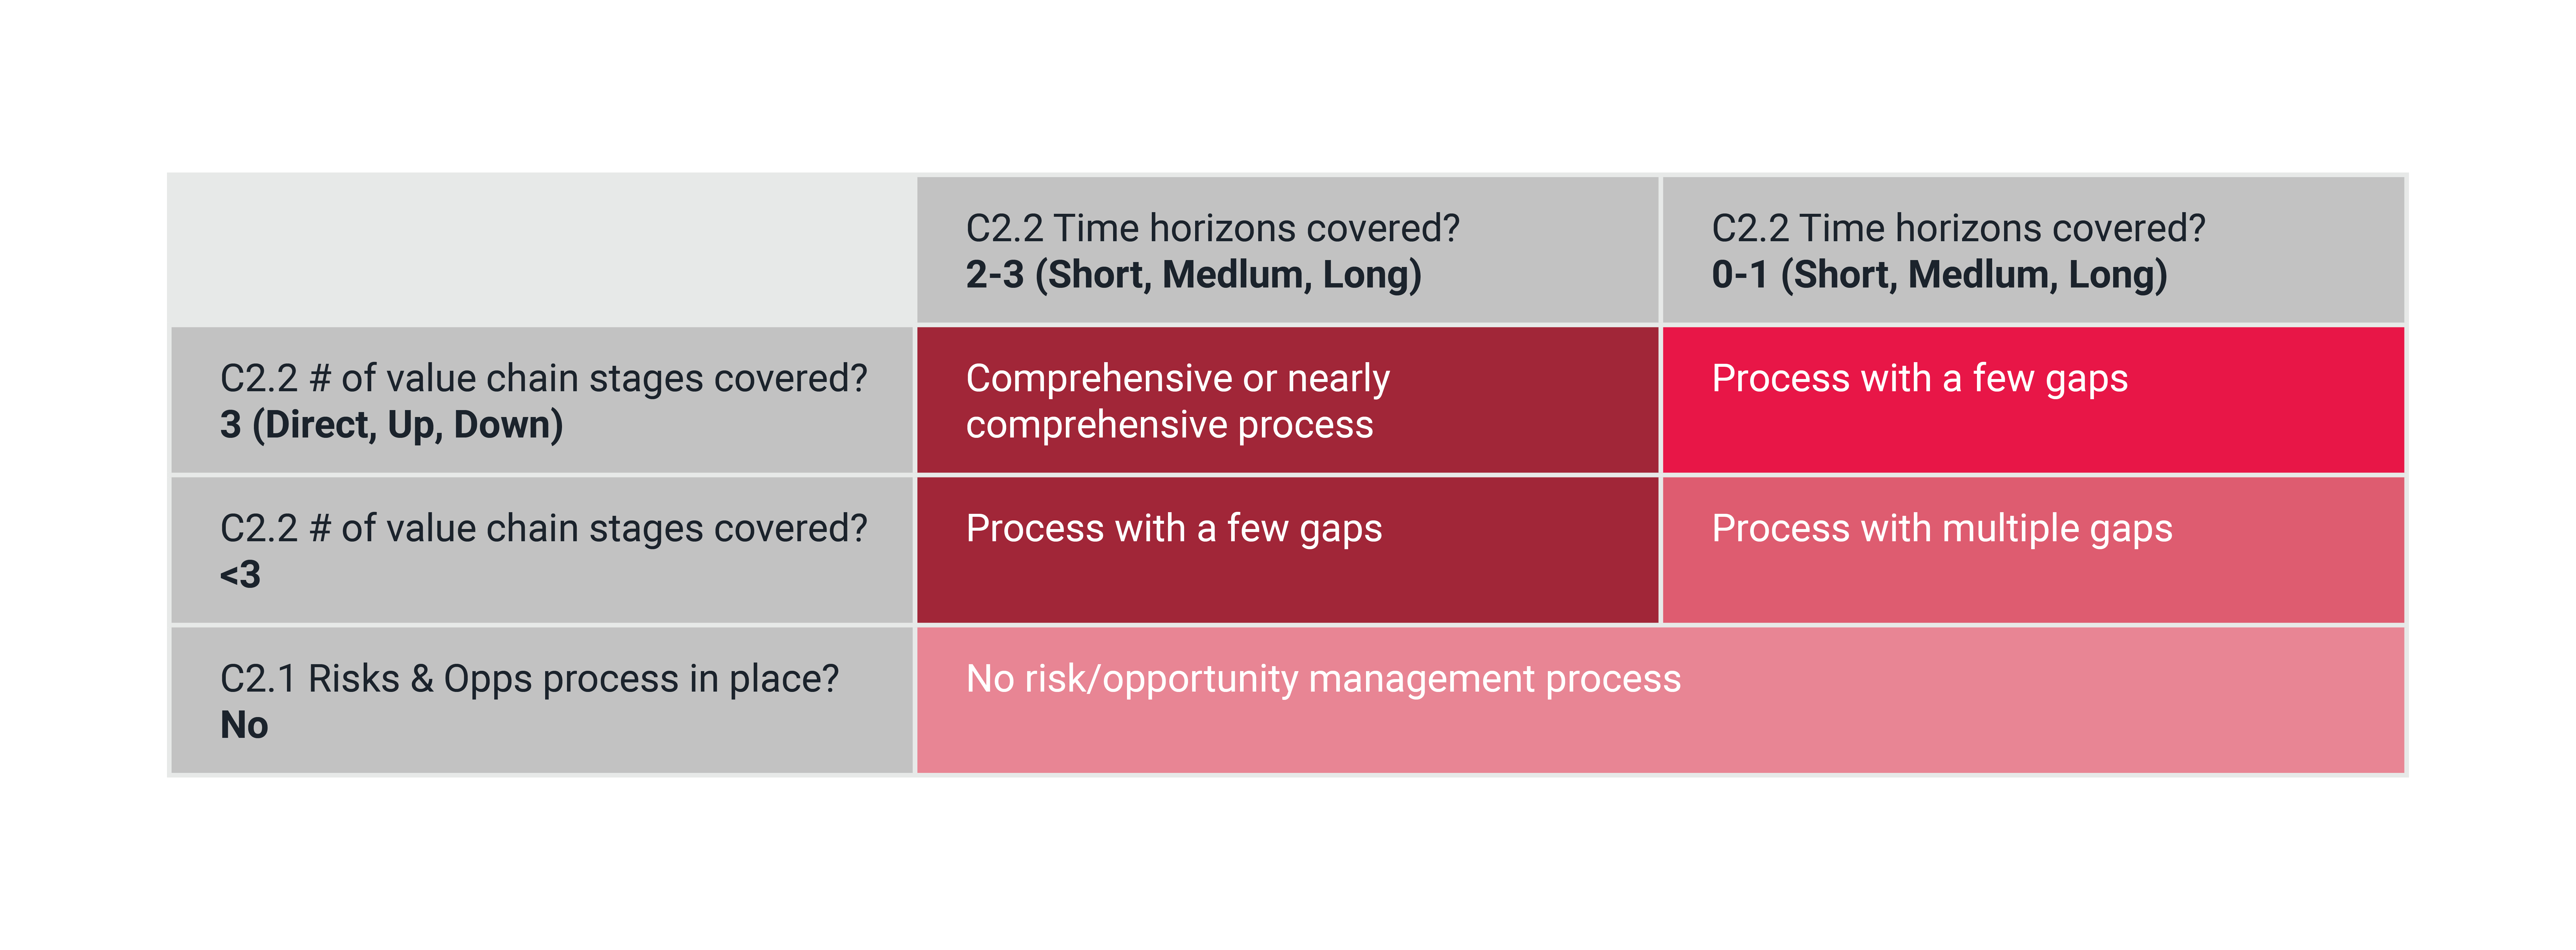
For C2.2 the respondents can specify multiple processes and for each process submit several properties, such as the time horizon(s) the process covers, the value chain stages it covers and the frequency with which it occurs. The answer to C2.1 (Yes/No) determines the applicability of the category ‘No risk/opportunity management process’ vs ‘Limited data’ in the case of a missing response in C2.2. The other three categories are based on a 2x2 mapping of possible responses to C2.2 on the dimensions of time horizons covered and value chain stages covered.

View larger version of graphic
Value chain engagement
We have defined five categories for this indicator across all levels.

View larger version of graphic
The categories are derived directly from the answers to question C12.1 in the CDP climate change questionnaire [4]. The question reads:
C12.1: “Do you engage with your value chain on climate-related issues?”
The answer “Yes, our investee companies”, which only appears for Financial Services institutions, is mapped to the ‘Customers’ categories.
Targets on track
We have defined five categories for this indicator across all levels.
View larger version of graphic
This indicator differs from the others as it is not based on a direct mapping of questionnaire answers to indicator categories. Rather, it follows from an analysis of the organization’s submitted absolute emissions target(s) and their most recent year emissions. The information is taken from the absolute target setting question in the questionnaire [4], namely:
C4.1a: “Provide details of your absolute emissions target(s) and progress made against those targets.”
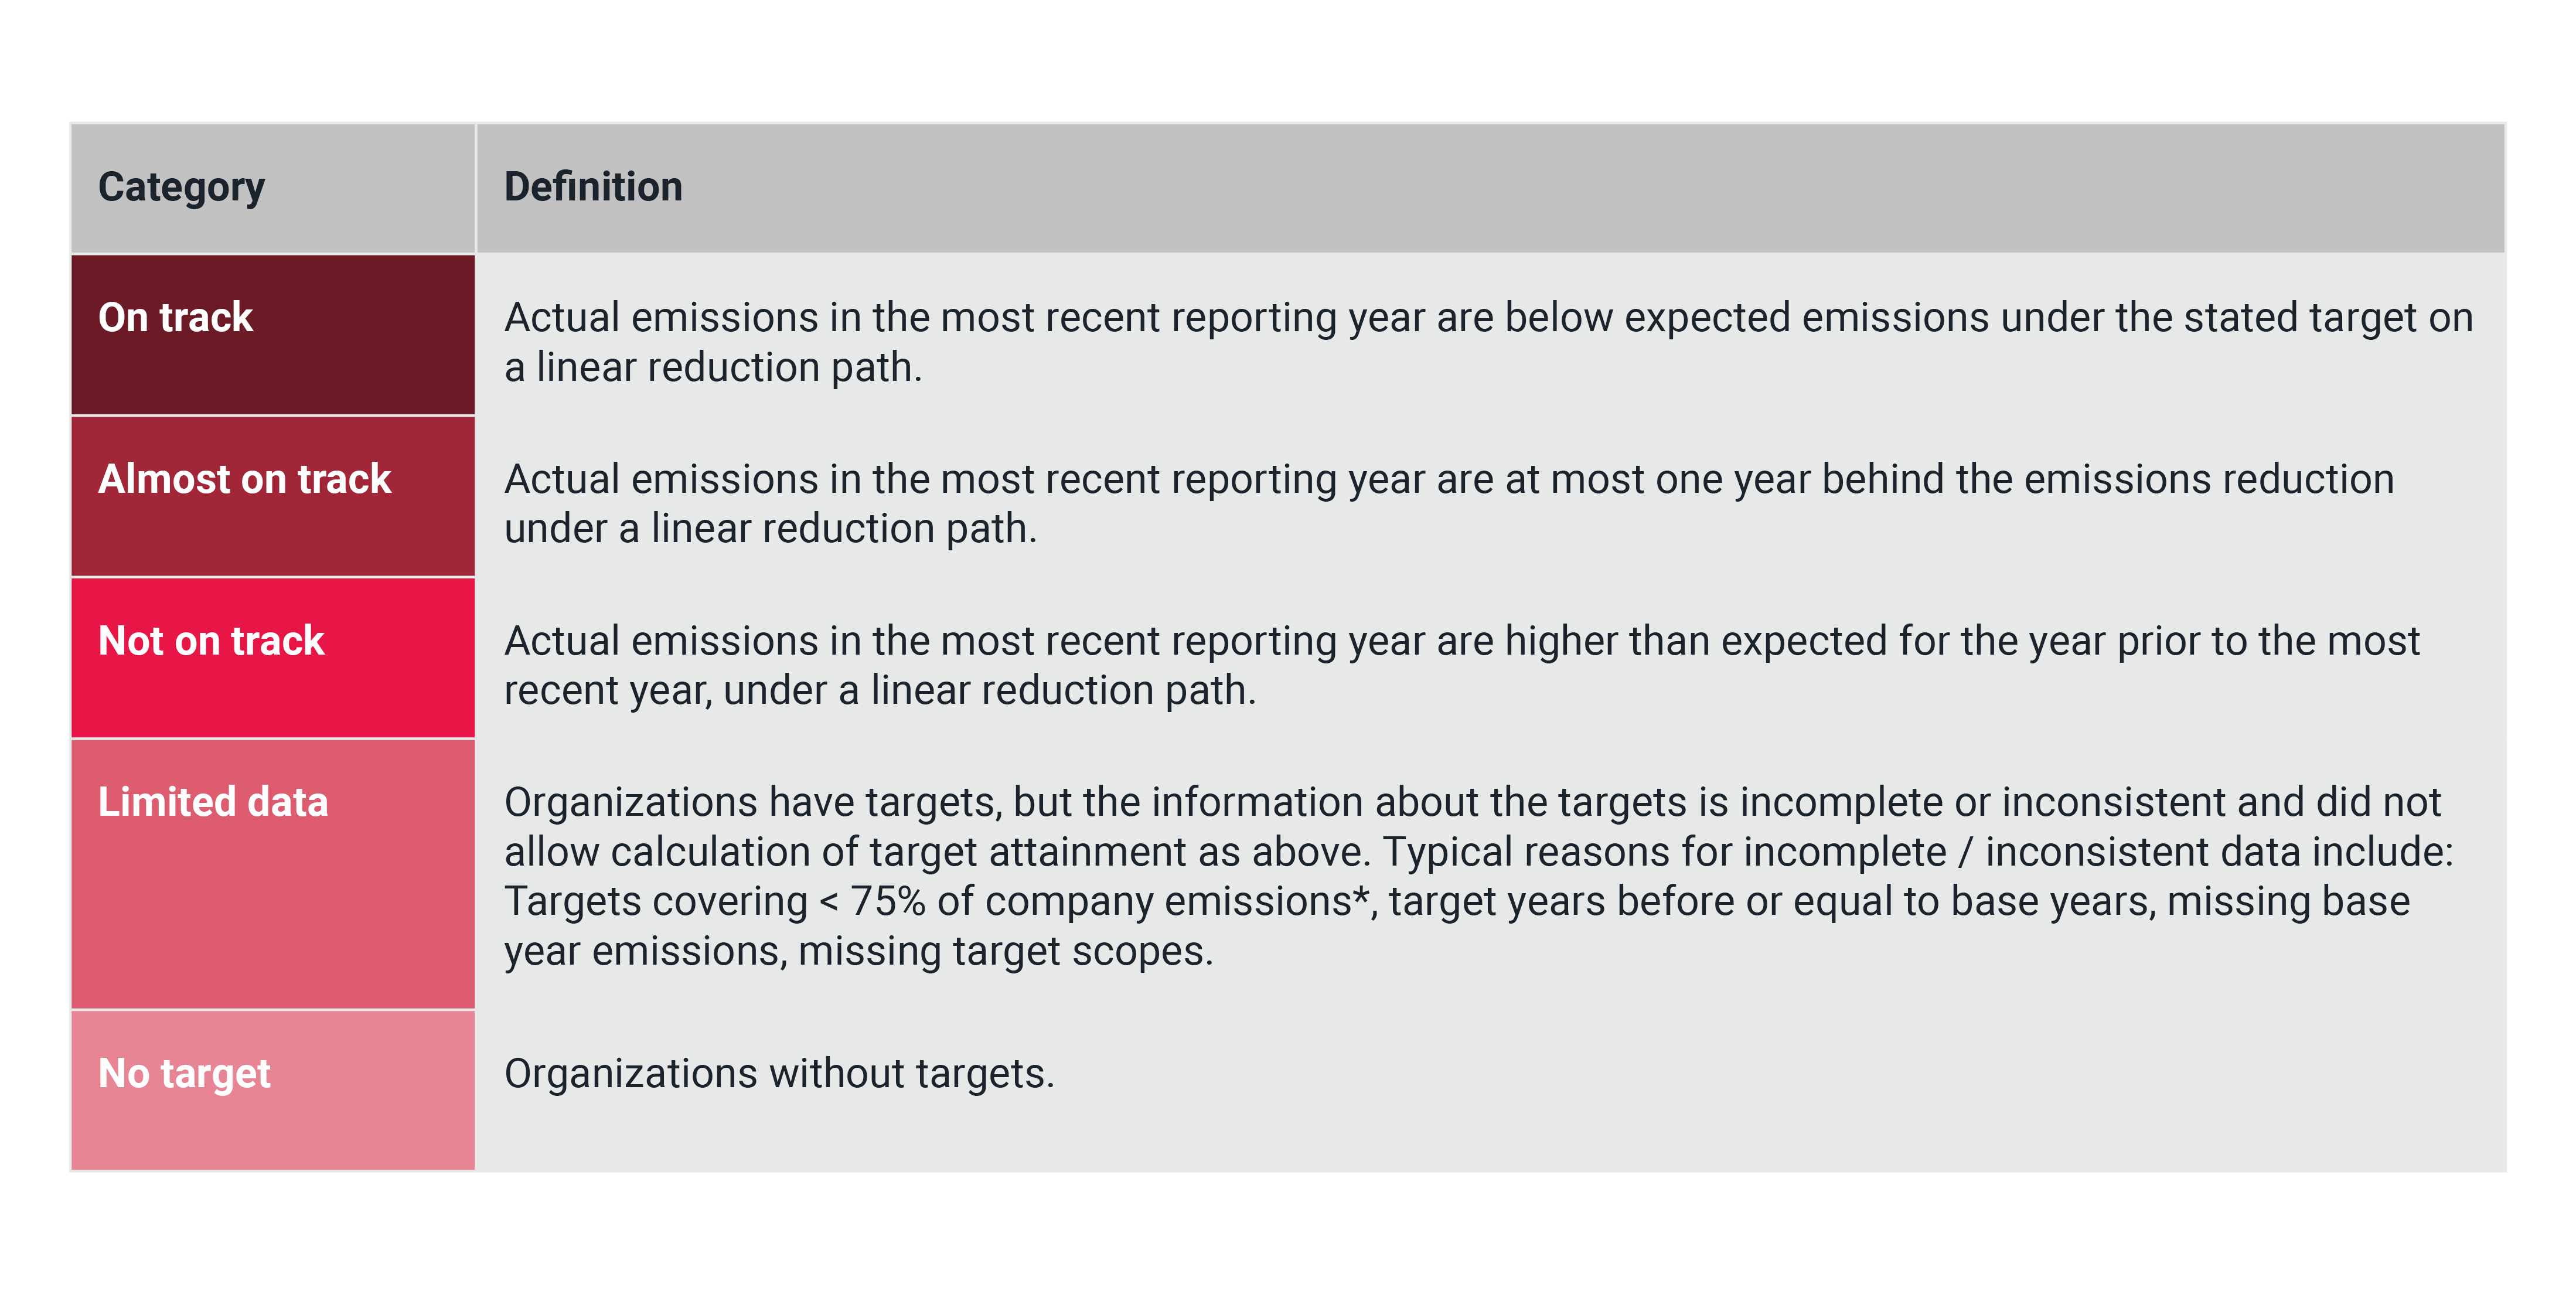
The expected emissions under target for the most recent reporting year are calculated based on an assumption of a linear reduction path between base year and target year. These expected emissions are then compared to the actual emissions in the reporting year.
For this analysis, we have chosen to compare actual emissions to an expected, linear reduction path in the absence of year-by-year target information. In practice, companies may foresee non-linear paths: some may plan greater reductions at first, reaping ‘quick wins’, then slowing down later, others may need time to put measures in place and see steeper reductions in later years. Note that where companies did provide intermediate target year information (for the same target, ie same base year and scope definition), we have taken this into account, ie we have only assumed linear paths between the individual interim target points.
The categories are then assigned as follows:

View larger version of graphic
* We filter out targets which do not cover total emissions in scope because it is not known why the remaining emissions were excluded and it is possible that emissions in the excluded part behave very differently from the emissions under target, potentially significantly offsetting emissions reductions. To avoid excluding too many targets we set this threshold for exclusion slightly below 100%, in this case 75%.
The impact indicators are different from category indicators as they show expected total emissions for future years (up to 2050) informed by the companies’ stated targeted reduction paths.

View larger version of graphic
Expected impact
The Expected Impact indicator shows the total aggregated emissions when adding up the expected emissions trajectories of all disclosing companies at a given level (global or sector).
The company emissions trajectories are based on absolute targets (as opposed to intensity-based targets). The information is taken from the absolute target setting question in the questionnaire [4], namely:
C4.1a: “Provide details of your absolute emissions target(s) and progress made against those targets.”
Only targets that had not been achieved yet and had target years in the future (of the reporting year) are included in the aggregation. Also, similar to the ‘Targets on track’ indicator, targets with incomplete or inconsistent information are excluded. In addition, because a robust split of emissions across scopes was required for aggregation, targets with inconsistent emissions at the scope level are excluded.
Similar to the approach for the ‘Targets on track’ indicator, where only a single base and target year are known, a linear reduction path is assumed. For multiple phase targets, each distinct target year to the next is assumed to be on a separate linear path.
Potential impact
The Potential Impact indicator shows what emissions reductions could be achieved if the total global (or sectoral) emissions were under the same targets as those set by companies disclosing through CDP (and included in our Expected Impact indicator). This means that the emissions for a given future year at the global/sector level are calculated based on:
the total emissions in the most recent reporting year and
a reduction percentage for the future year – where that reduction percentage is equal to the weighted average targeted reduction by the disclosing companies for that year (also relative to the most recent reporting year).
Since we always use total emissions, not just total corporate emissions, as the reference for our global and sectoral emission indicators, we also used these total emissions as the starting point for this indicator. To achieve these pathways, all corporate actors globally would have to set (and meet) targets like the companies whose targets are shown in the Expected Impact indicator. In addition, similar reductions would also have to be achieved from non-corporate actors.
For the global level we also show a benchmark pathway, to help the viewer understand how fast global emissions would need to reduce to avoid breaching the 1.5°C limit. This benchmark is based on the reduction rates in the SBTi’s cross-sector pathway. Since the SBTi cross-sector pathway excludes the agriculture and waste sectors, amongst others, the benchmark essentially assumes that these sectors reduce at the same rate as the cross-sector pathway. As the SBTi pathways are updated, the benchmarks shown here will also be reviewed and revised.
Data preparation
Emissions filtering process
We applied different filtering steps to the emissions per company, which formed the basis for all category-based indicators at Global, Country and Sector level. The purpose of the filtering process was to remove potential incorrectly reported emissions values from the aggregation and submissions for very different reporting periods, which could reduce the accuracy of the final result.
The following steps were applied:
External sources
In addition to CDP questionnaire responses and information on company targets from SBTi, we used the following data sources to calculate the indicators.
Acknowledgements
Methodology, analysis and narrative created in collaboration with 7Gen GmbH and AG Climate & Energy Ltd.
FAQ
Glossary
Level: We show data at four different levels in the tracker: Global, Country, Sector, Index. The country-level results only exist for the disclosure indicator on Step 1.
MtCO2e: Megatonnes (106 metric tonnes) of carbon dioxide equivalent (ie including several/all greenhouse gases, rebased according to their global warming potential)
Reporting year: The year shown on the tracker. This is the calendar year preceding the questionnaire/disclosure year which the analysis is based on. For example, the data shown as reporting year 2021 derived from questionnaire responses from the 2022 disclosure cycle.
Sector: Sectors in the Tracker, to the extent possible, are based on the IPCC Common Reporting Framework used by the UNFCCC. However, several datasets had to be combined to allow better matching of the national inventories with the corporate inventory data reported through CDP. See 'Where does the data in the tracker come from?' above, for more information on the sector definitions. The sectoral emissions, and their aggregation, are used to calculate the proportion of total emissions globally/per sector disclosed through CDP.
Footnotes
Note that although all companies’ responses received by 1 October in the disclosure cycle are in principle considered, the emissions indicators only contain responses from companies that report for an accounting year no more than 2 years preceding the disclosure cycle and which pass the emissions filtering process.
‘Total emissions’ here refers to companies’ Scope 1 emissions only. Aggregated Scope 1 values are the main values displayed in all emissions-based graphs in the tracker. Aggregation taking into account Scope 2 emissions as well are shown in the tool tips which appear when hovering with the cursor over an emissions graph data point.
In 2022, the revenue data for five FTSE 100 companies and one S&P 500 company could not be obtained, and therefore they had to be excluded from all analyses based on revenue shares.
The question numbers quoted in the methodology can be found in the 2020 to 2023 climate questionnaires.